
Climate projections on time-scales longer than a decade provide an information source for mitigation and adaptation planning. EUCP is pioneering new ways to extract more information from sets of existing and future climate model experiments. This will help users to make better climate related decisions, such as planning infrastructure investments.
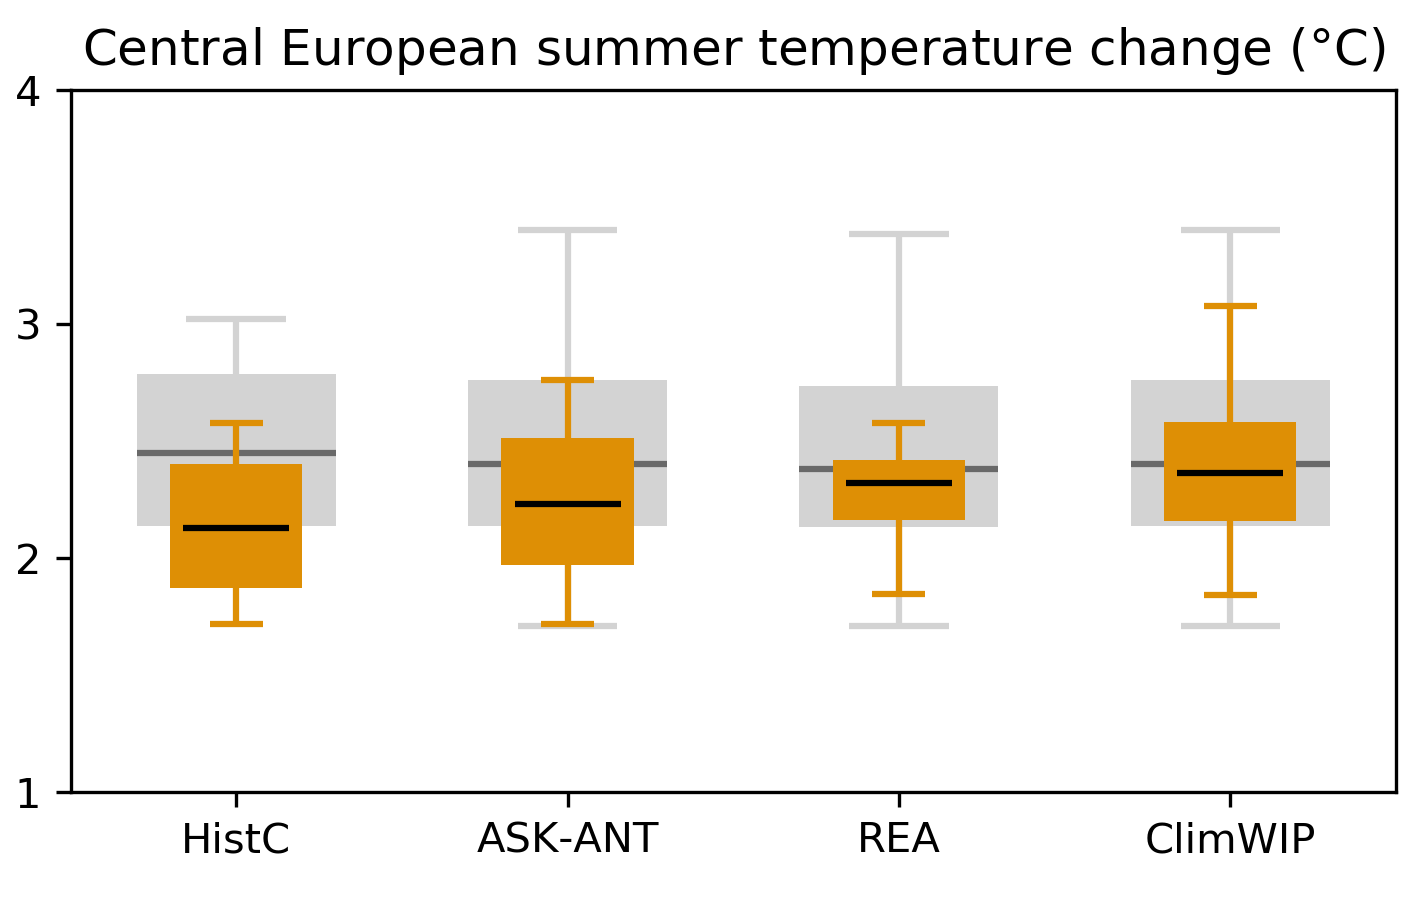
Projected 2040-2060 temperatures over Central Europe. The lighter boxes and lines represent the distribution of climate projections within the last CMIP assessment (CMIP5). The darker boxes and lines indicate the equivalent observationally constrained ranges
On timescales longer than 10 years, successive Climate Model Intercomparison Projects (CMIPs) have provided the global climate simulations that often underpin longer term climate change assessments by the IPCC and in national studies. One of the key challenges has been how we navigate these projected changes and make sense out of the wide range of simulations that they represent. EUCP looks to help to address two aspects of this challenge. Firstly, work is ongoing to explore a number of methodologies that use comparisons of the model results with observed changes and/or observed climatology to down weight poorer simulations. By doing so we can assess the impact on the range of projected future climate changes for Europe. Secondly, we often need to sub-select these global climate simulations. Whether this is to pull out particular simulations that exemplify a ‘most likely’ or ‘high end’ climate response, or to identify the role of, say circulation change or soil moisture, on projected changes. This is another area where EUCP is developing a set of approaches to achieve these aims.
In the first phase of EUCP we have been developing and testing methods to identify the more plausible climate simulations, and we have some promising approaches. The figure shown uses projected 2041-2060 temperature change over Central Europe to illustrate how observational comparisons with historical data can add value. The grey boxes and lines represent the distribution of climate projections within the last CMIP assessment (CMIP5). The orange boxes and lines indicate the equivalent observationally constrained ranges. In this example, all four methods tend to rule out higher end projected changes, with both the upper bound and central estimates shifted to lower values. This is encouraging because these four methods have used different observations and diverse methodological approaches to do so, and yet have come to some similar conclusions. It is worth saying that we’ve also identified other regions and variables where the various methods do not agree (which would flag caution in adopting constraints from one method over another).
These approaches and results for both temperature and precipitation, and for a wider range of European regions, are currently being written up for publication. We are now looking for potential case studies to start exploring how the outputs of these methods could add value and feed through into downstream climate impact assessments. Interested users of global climate simulations can get in touch through this link.
Brunner, L., McSweeney, C.F et al. (Submitted to J. Clim.) Quantifying uncertainty in projections of future European climate: a multi-model multi-method approach.

 Funded by the European Union under Horizon 2020.